Dataristix® integrates OpenTelemetry
Check a box to enable tracing, logging, or metrics! The new Dataristix version supports OpenTelemetry out of the box and enables you to:
- Analyze performance bottlenecks in dataflow tasks.
- Monitor task metrics such as input, output or error counts.
- Aggregate logs from Core and Connector modules.
- Send your own metrics! Use the integrated Telemetry output connector to send results of your dataflow tasks to your preferred telemetry collector.
In this article we'll be looking at:
- Using the Microsoft Aspire dashboard to visualize logs, traces and metrics locally
- Sending logs, traces, and metrics to Grafana Cloud dashboards.
We'll be using Dataristix running on Microsoft Windows here but you can also run a containerized version. You only need to download and install the Dataristix 2 Core installer to follow this example.
Enable telemetry in Dataristix
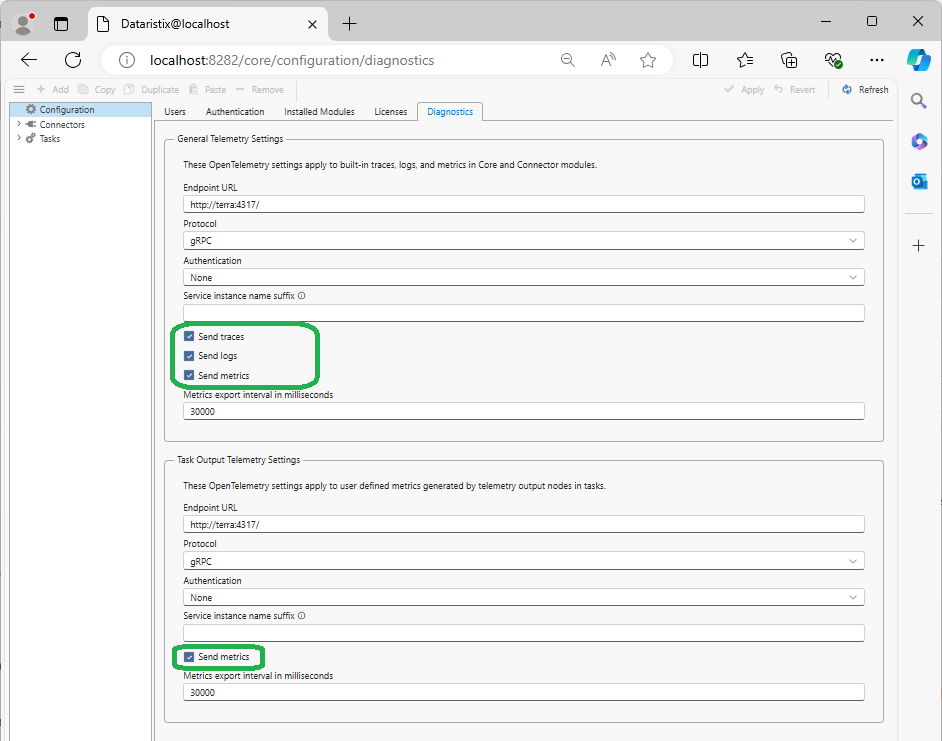
Goto the the Dataristix Configuration and enable telemetry. Optionally enable or disable built-in logs, traces, metrics, and enable or disable task output metrics. You can leave all other settings as the default. Click on the "Apply" toolbar button after making any changes.
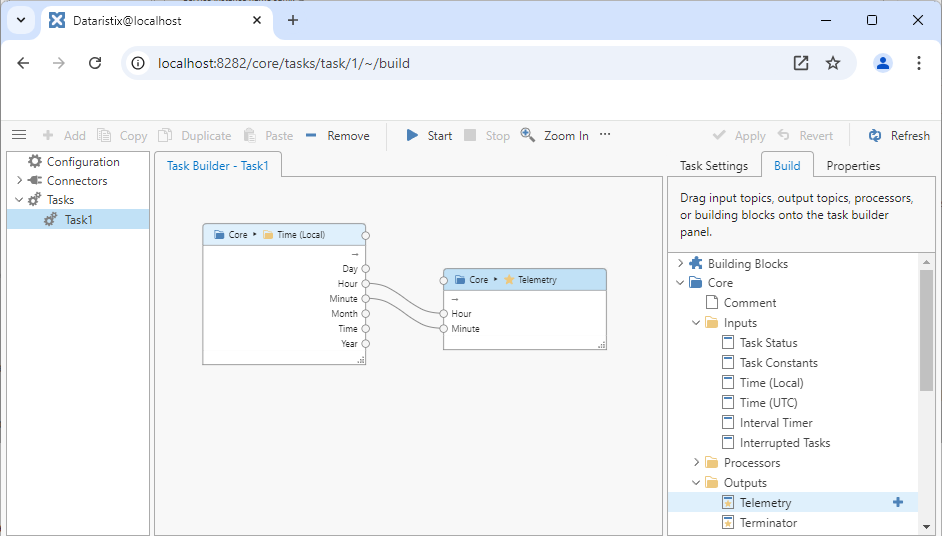
Next we'll add a simple task. In this case, the task captures the local time and sends it to the Telemetry output connector.
Using the Aspire Dashboard
We'll be using Docker Desktop on Microsoft Windows to run the Aspire dashboard. Install and run Docker Desktop on the same computer as Dataristix, then open a command prompt to run the Aspire dashboard container:
docker run --rm -it -p 18888:18888 -p 4317:18889 -d --name aspire-dashboard mcr.microsoft.com/dotnet/aspire-dashboard:8.1.0
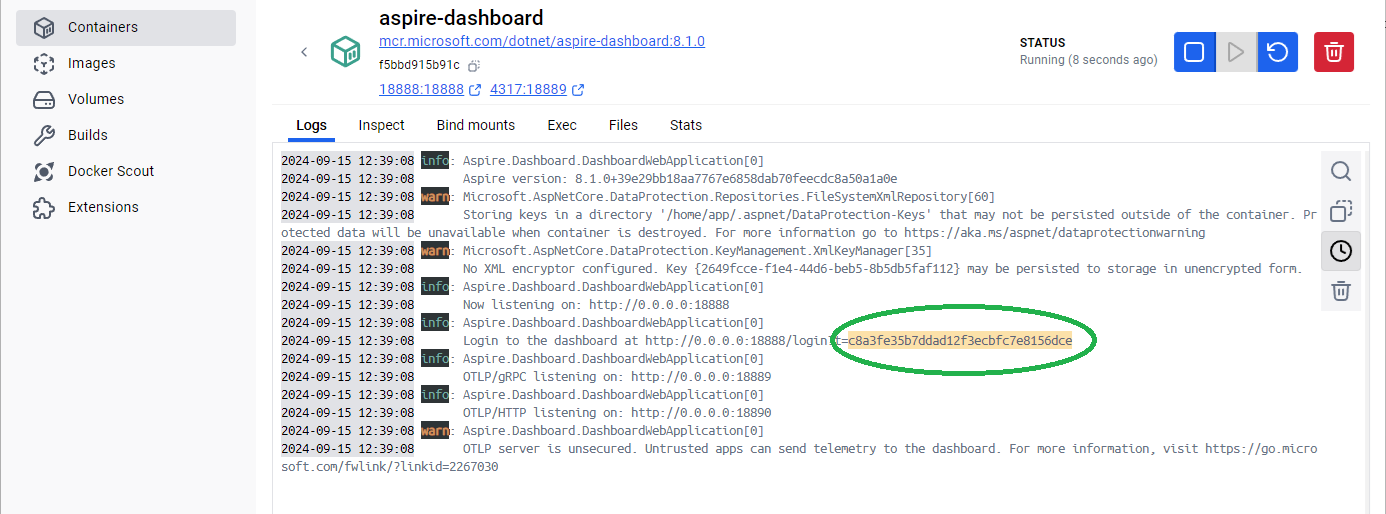
By default, the dashboard uses an API key for login that you can lookup in the console log of the container. Locate the container in Docker Desktop, click on the container to view its console log, then copy the API key:
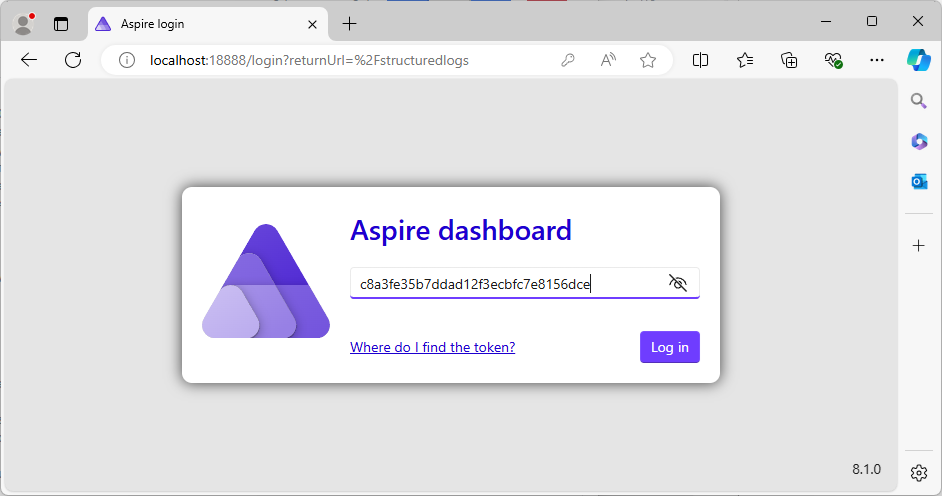
Browse to the dashboard URL at http://localhost:18888/ and enter the API key to login.
You can find more information on the Microsoft Aspire dashboard website.
Now start the task in Dataristix to generate some telemetry data. This will collect built-in logs, traces and metrics as well as the telemetry output metrics that we have defined in the task itself by sending numerical data (the current hour and minute) to the telemetry output connector.
You can view the outcome in the Aspire dashboard.
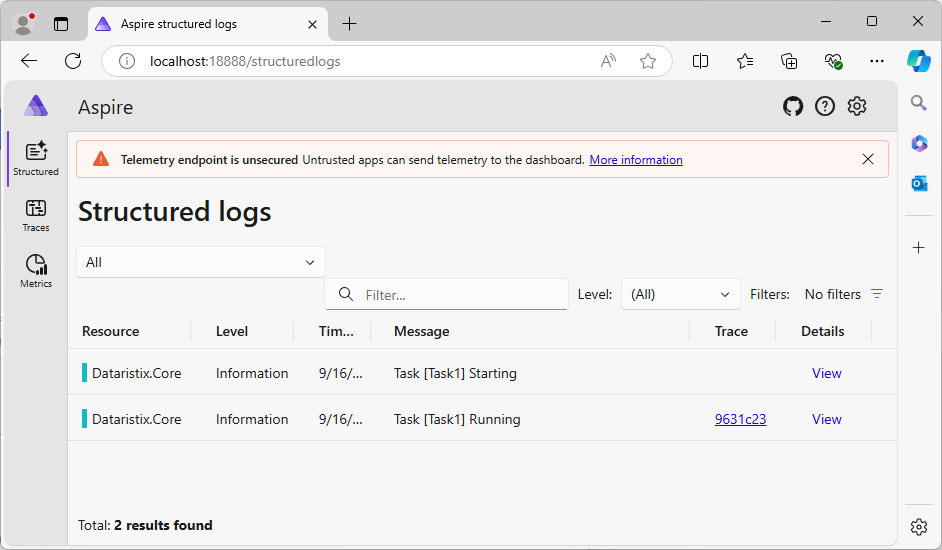
Logs:
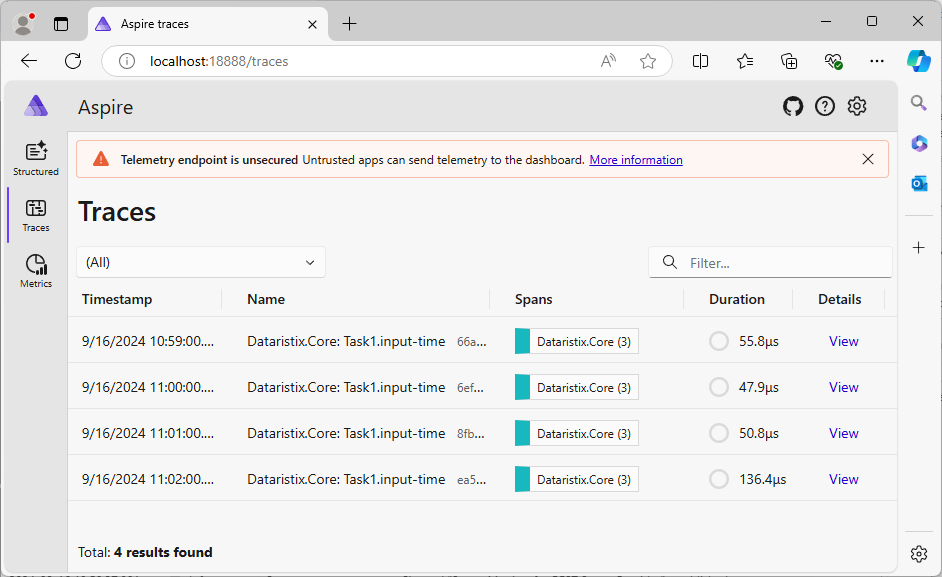
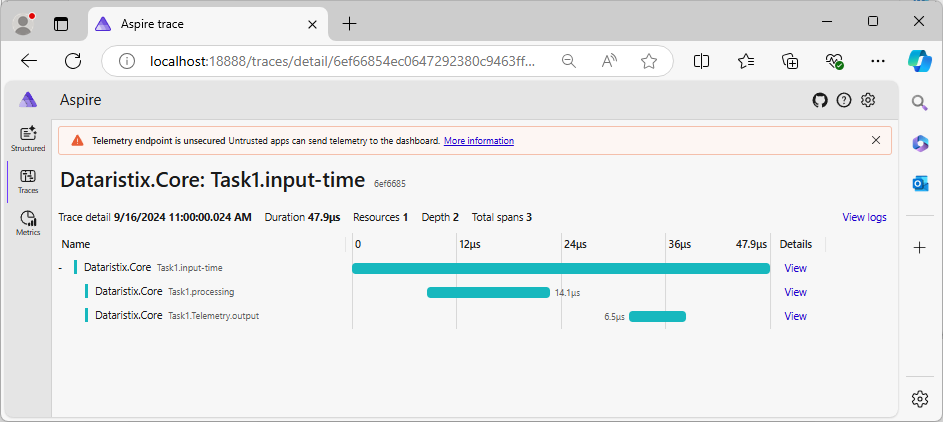
Traces:
Built-in Metrics:
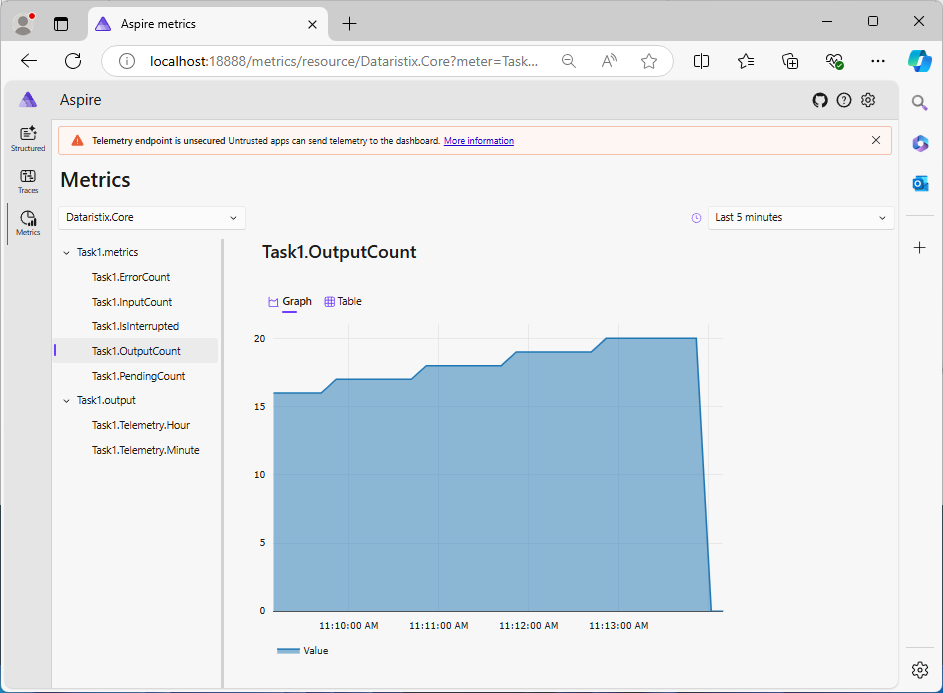
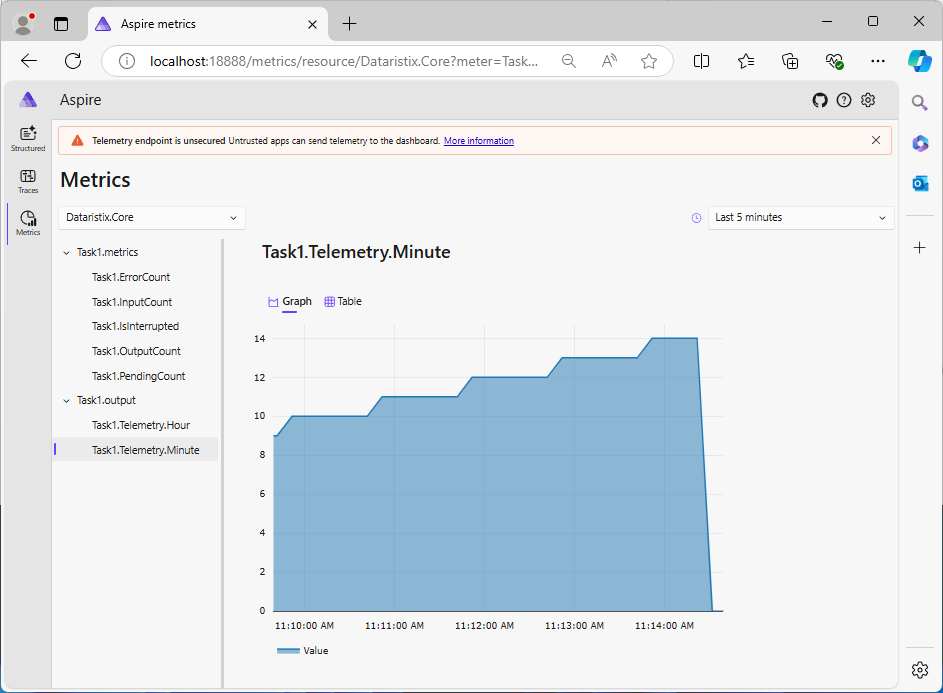
User defined task output metrics:
Using Grafana Cloud dashboards
Using Grafana Cloud dashboards works best by installing the local Grafana Alloy telemetry collector which then forwards telemetry data to your cloud instance. To install Alloy, please follow the detailed instructions given for Grafana Alloy.
If you have the Microsoft Aspire container running, then please ensure that the container is stopped before installing Grafana Alloy so that Alloy can listen to the telemetry port.
That's it! There is no need to change Dataristix settings. Dataristix will continue sending telemetry data to the default URL at http://localhost:4317 and Grafana Alloy will receive Dataristix telemetry data and foward it to Grafana Cloud.
You can now take advantage of the advanced filtering and reporting capabilities available with Grafana dashboards.
Feedback
Do you have feedback, questions, or suggestion? We'd love to hear from you!
Dataristix® is a registered trademark of Rensen Information Services Limited in the U.S. and other countries. All other trademarks are the property of their respective owners.