Dataristix® + PostgreSQL® + Grafana®
In this application note, we combine Dataristix with PostgreSQL (it also works with Timescale DB) and Grafana for a monitoring solution that includes data storage and dashboards. Here we use an integrated solution that you can run on-premises, but you may also shift some or all components into the cloud.
To simplify deployment for this example, we install the components as Docker containers. For convencience, you may want to consider Docker Desktop for your Docker installation. Alternatively, the solution components can be installed directly on supported operating systems.
We have added Dataristix, PostgreSQL and Grafana containers to our Docker Compose file with default settings. We have also included a "docker compose override" file, configuring the Dataristix container user as "root". You may want to review settings and configure a different user that has access to the required Dataristix volumes (please see Datarisix on Docker Hub for more information).
You can download the Docker files for this example here:
docker-compose.yml
docker-compose.override.yml
Place both files into a new folder, then open a command prompt and run:
docker compose up --detach
This will start Dataristix, PostgreSQL and Grafana. "Detach" keeps the docker containers running even after you close the terminal window.
Allow some time for all connector modules to initialize, then browse to http://localhost:8282 to configure your Dataristix instance for data collection.
When prompted, then select the Dataristix Trial License in the initial dialog to avoid any runtime limits.
Note that the Docker Compose files include the Dataristix connectors for PostgreSQL and MQTT only. The MQTT connector is added for your experimentation but not required to run this example. Edit the Docker files to add additional connector modules; please see Docker Hub for further information.
Add Database Connection
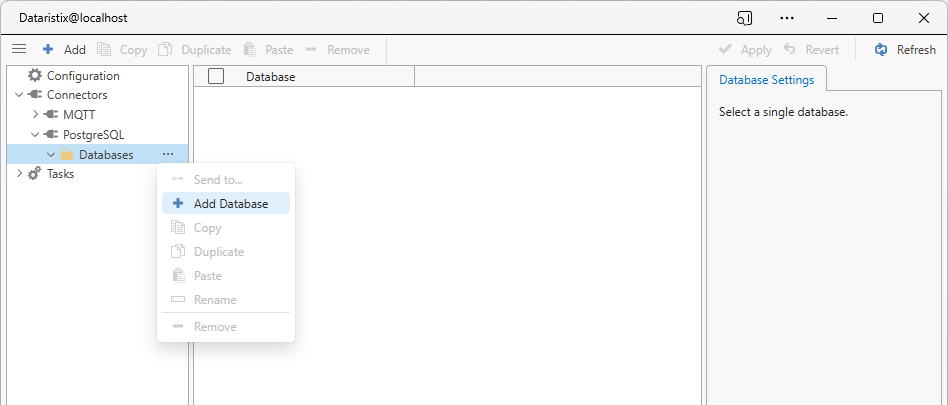
Now that everything is up and running, expand the PostgreSQL node in the Dataristix navigation tree, right-click, then select "Add Database".
Enter the following parameters in the dialog.
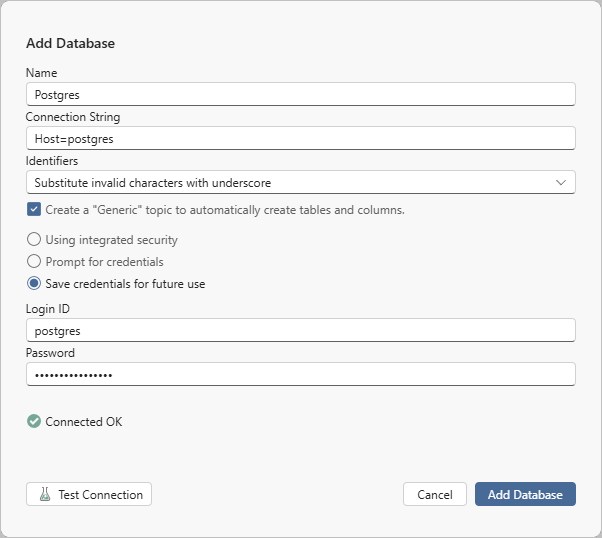
Enter any name you like. Enter "Host=postgres" as the connection string, because the database host is the "postgres" container ("postgres" is the container name given in the Docker Compose file). Also check "Create a Generic topic..." for convenience to later create required database tables automatically (a generic topic can also be added separately). Use default login ID "postgres" and default password "mysecretpassword". Test the connection, then click "Add Database".
Create a Task
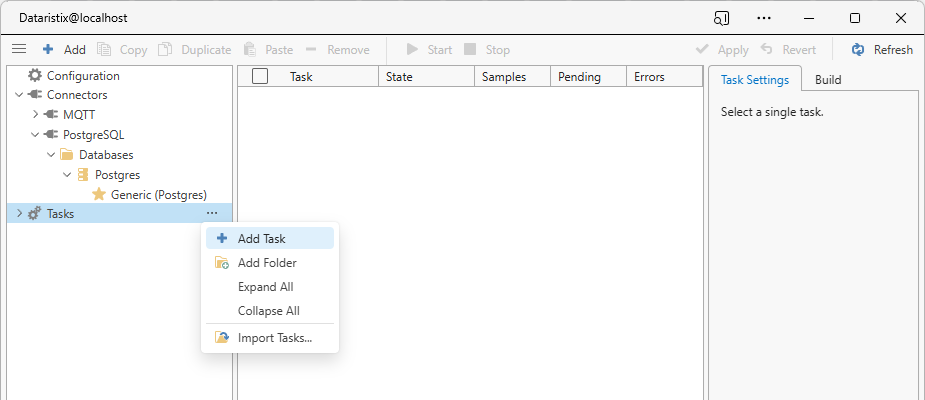
Next, add a task to define a data flow. Right-click on the "Tasks" node in the Dataristix navigation tree, then select "Add Task". Name the task anyway you like; here we simply keep the default name "Task1".
Select "Task1", then expand the build panel and drag Inputs, Processors and Outputs from the "Build" panel on the right onto the Task Builder panel.
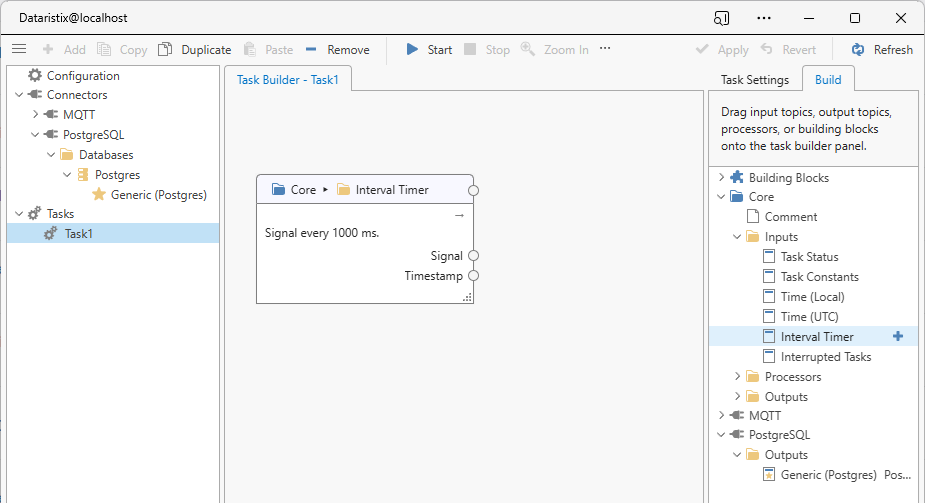
In this example, we generate a simple ramp signal utilizing the Interval Timer input so that the solution is self-contained; an actual system may use OPC UA or MQTT data sources instead. Our task looks like this (after adding more task nodes and connecting tags):
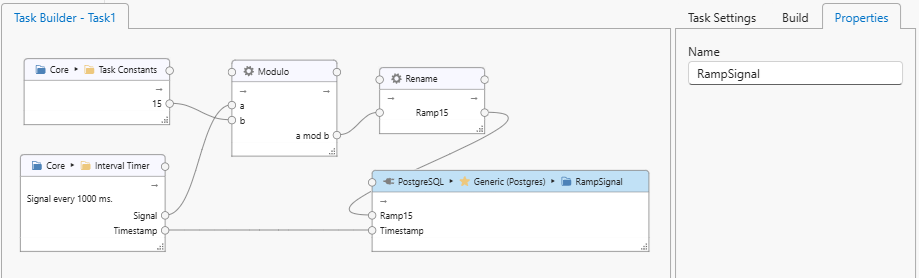
We use:
- The Interval Timer Input, to generate an increasing Signal counter every second.
- The Task Constants Input, to configure a constant numerical value of 15.
- The Modulo Processor, to limit the range of the Signal counter to values between zero and fourteen.
- The Rename Processor, to rename the "a mod b" output of the Modulo Processor to something more suitable as a column name for the PostgreSQL database table.
Finally, we select the "PostgreSQL" task node and rename it to "RampSignal"; the generic node will use this name as the name of the table that is automatically generated by Dataristix, prefixed with "U_" by default. The prefix for automatically generated tables can be configured in the database settings, including a blank prefix.
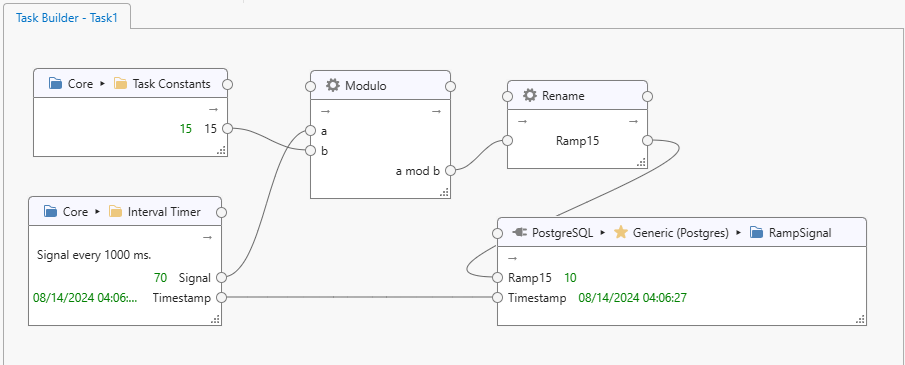
Start Task
Right-click on "Task1" and select "Start". You will now see that the task nodes display live value as they are stored into the database. Note that the timestamp data is in UTC, the recommended timestamp time zone for data storage. If you prefer, then you can use one of the date and time processors to convert to local time or a different timezone.
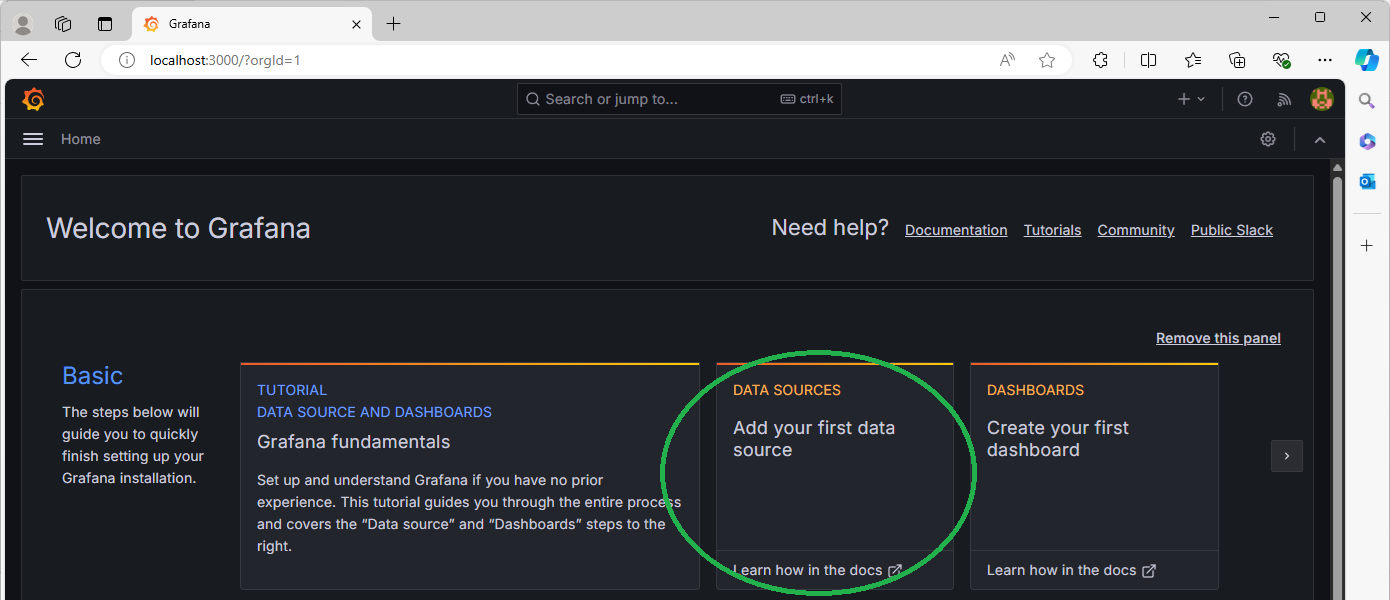
Configure Grafana Data Source
Grafana is accessible at http://localhost:3000 with username "admin" and password "admin". Login and click on "Data Sources" to hook up our new "RampSignals" table in the PostgreSQL database.
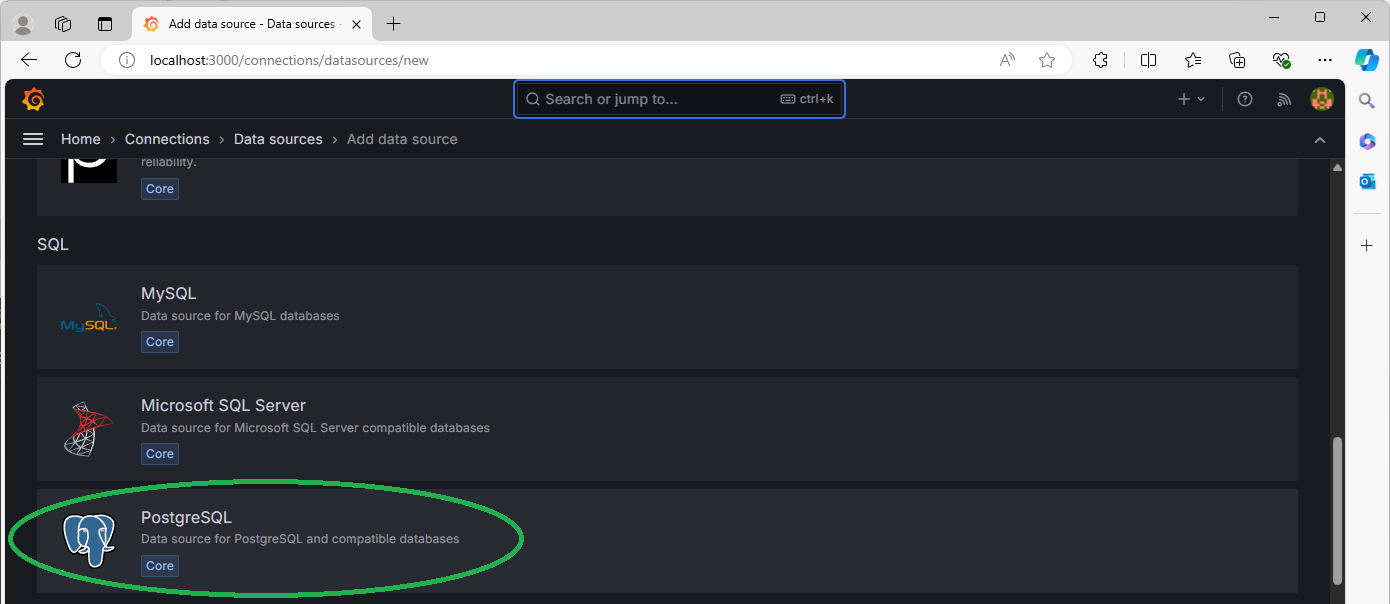
Scroll down to the "SQL" section and select the PostgreSQL database.
Configure the data source as follows:
- Host URL:
postgres:5432 - Database name:
postgres - Username:
postgres - Password:
mysecretpassword - TLS/SSL Mode:
disable - Version:
15(or16if available in the dropdown) - If using TimescalDB, then enable the option
Leave the rest as the default and click "Save & test". The result should be "Database Connection OK".
Configure Grafana Dashboard
Next, go back to the Grafana Home page and select "Dashboards".
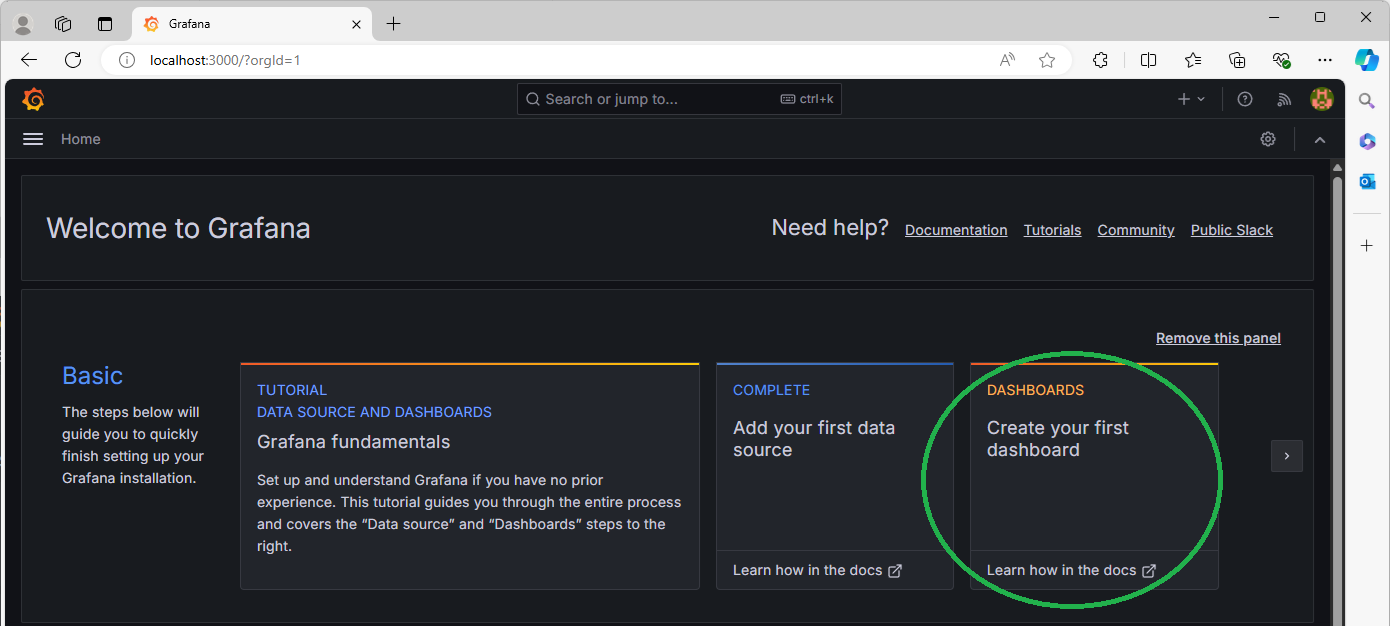
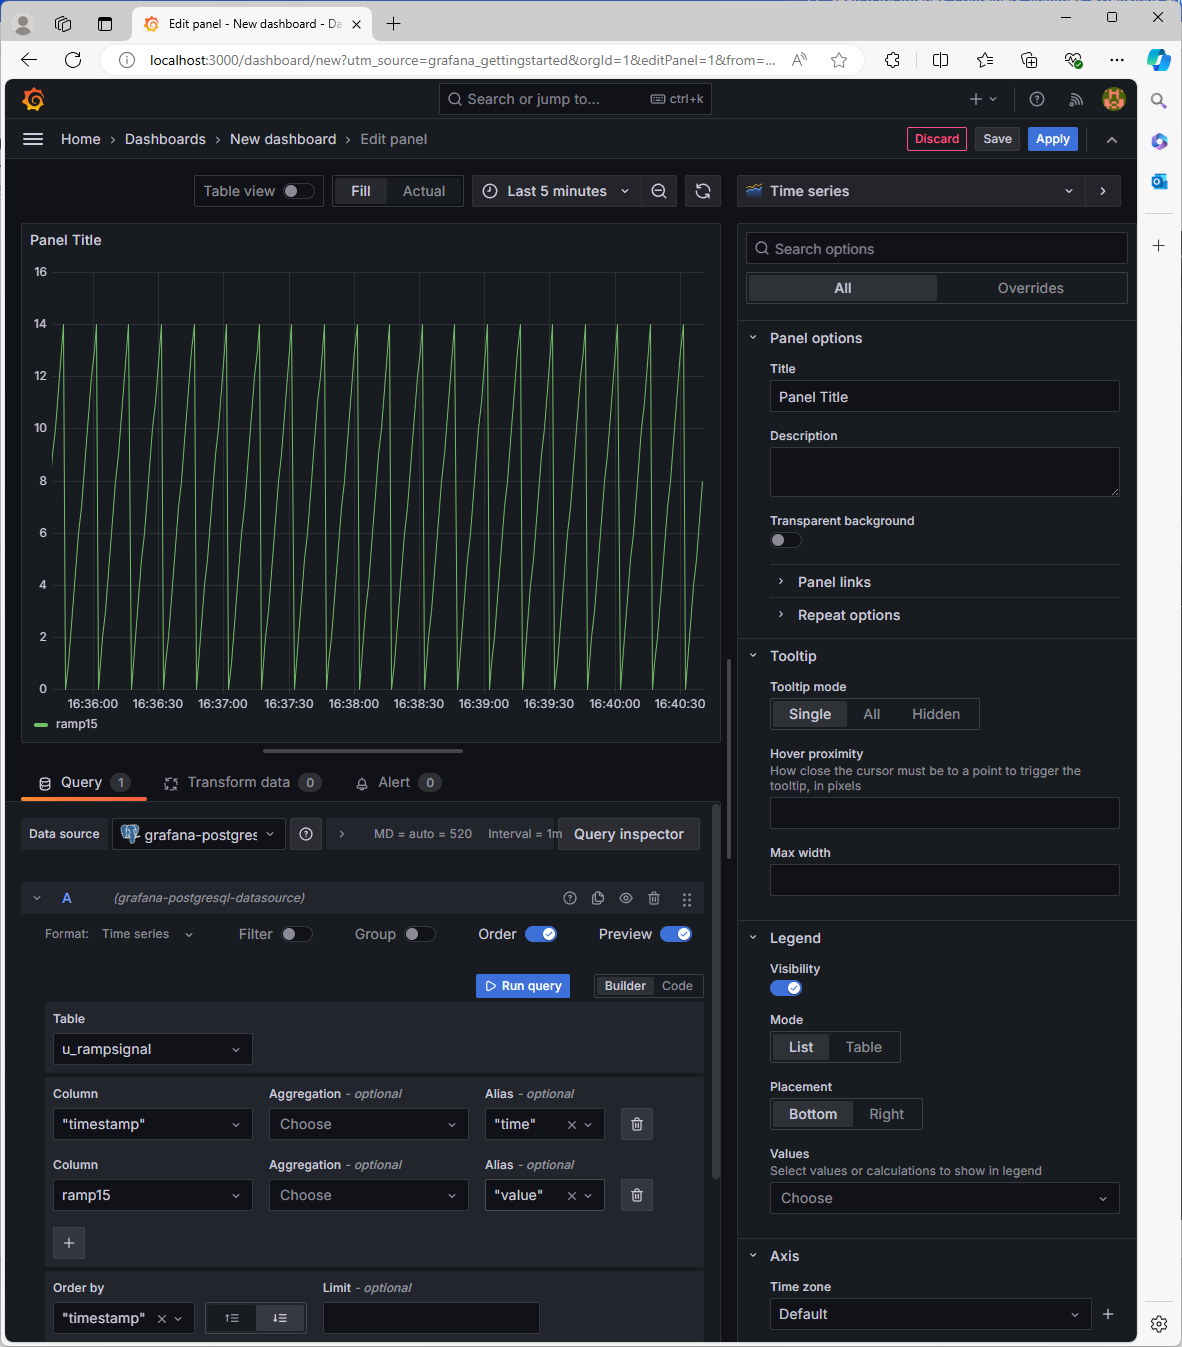
Next, select "Add visualization". In the "Select data source" dialog, select the "grafana-postgresql-datasource". In the Query editor, configure the dash board as follows.
- Select format "Time series"
- Enable "Order"
- Select table "u_rampsignal"; this is the table automatically created by Dataristix.
- Select column "timestamp"; this is the time column. Select Alias "time".
- Add another column and select "ramp15"; this is the ramp value. Select Alias "value".
- Order by "timestamp" in descending order and remove the "Limit".
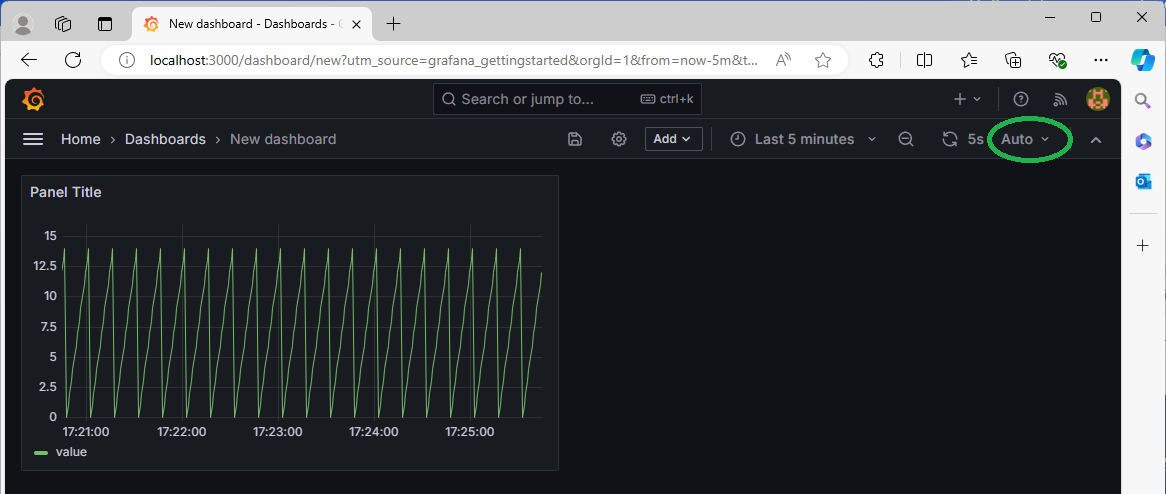
Select the "Last 5 minutes" above the "Panel Title" and you should see a chart of the ramp signal as expected. Click "Apply" to confirm settings:
You now have a dashboard that monitors the Ramp signal! Select "Auto" refresh to continously monitor latest values.
Further work
We have demonstrated how to quickly get started with Dataristix, PostgreSQL and Grafana as a monitoring solution. The example may serve as the basis for a more elaborate setup. For production use, you will need to change usernames and passwords, add suitable persistent volumes for PostgresSQL and Grafana, and use secure connections, potentially behind a load balancer.
Please contact us for any questions you may have!
Dataristix is a registered trademark of Rensen Information Services Limited. Docker and the Docker logo are trademarks or registered trademarks of Docker, Inc. in the United States and/or other countries. Docker, Inc. and other parties may also have trademark rights in other terms used herein. The Grafana Labs Marks are trademarks of Grafana Labs, and are used with Grafana Labs’ permission. We are not affiliated with, endorsed or sponsored by Grafana Labs or its affiliates. PostgreSQL is a registered trademark of the PostgreSQL Community Association of Canada. All other product names, trademarks and registered trademarks are the property of their respective owners.